Using the AiNet
Access the Jupyter notebook with the code available here!
Run notebook online via Binder: ![]()
Introduction
Clustering is an unsupervised machine learning task that groups data into clusters.
In this notebook, we explore AiNet (Artificial Immune Network). AiNet uses concepts such as antibody affinity and clone suppression to identify cluster centers.
Objective: Demonstrate AiNet on random datasets:
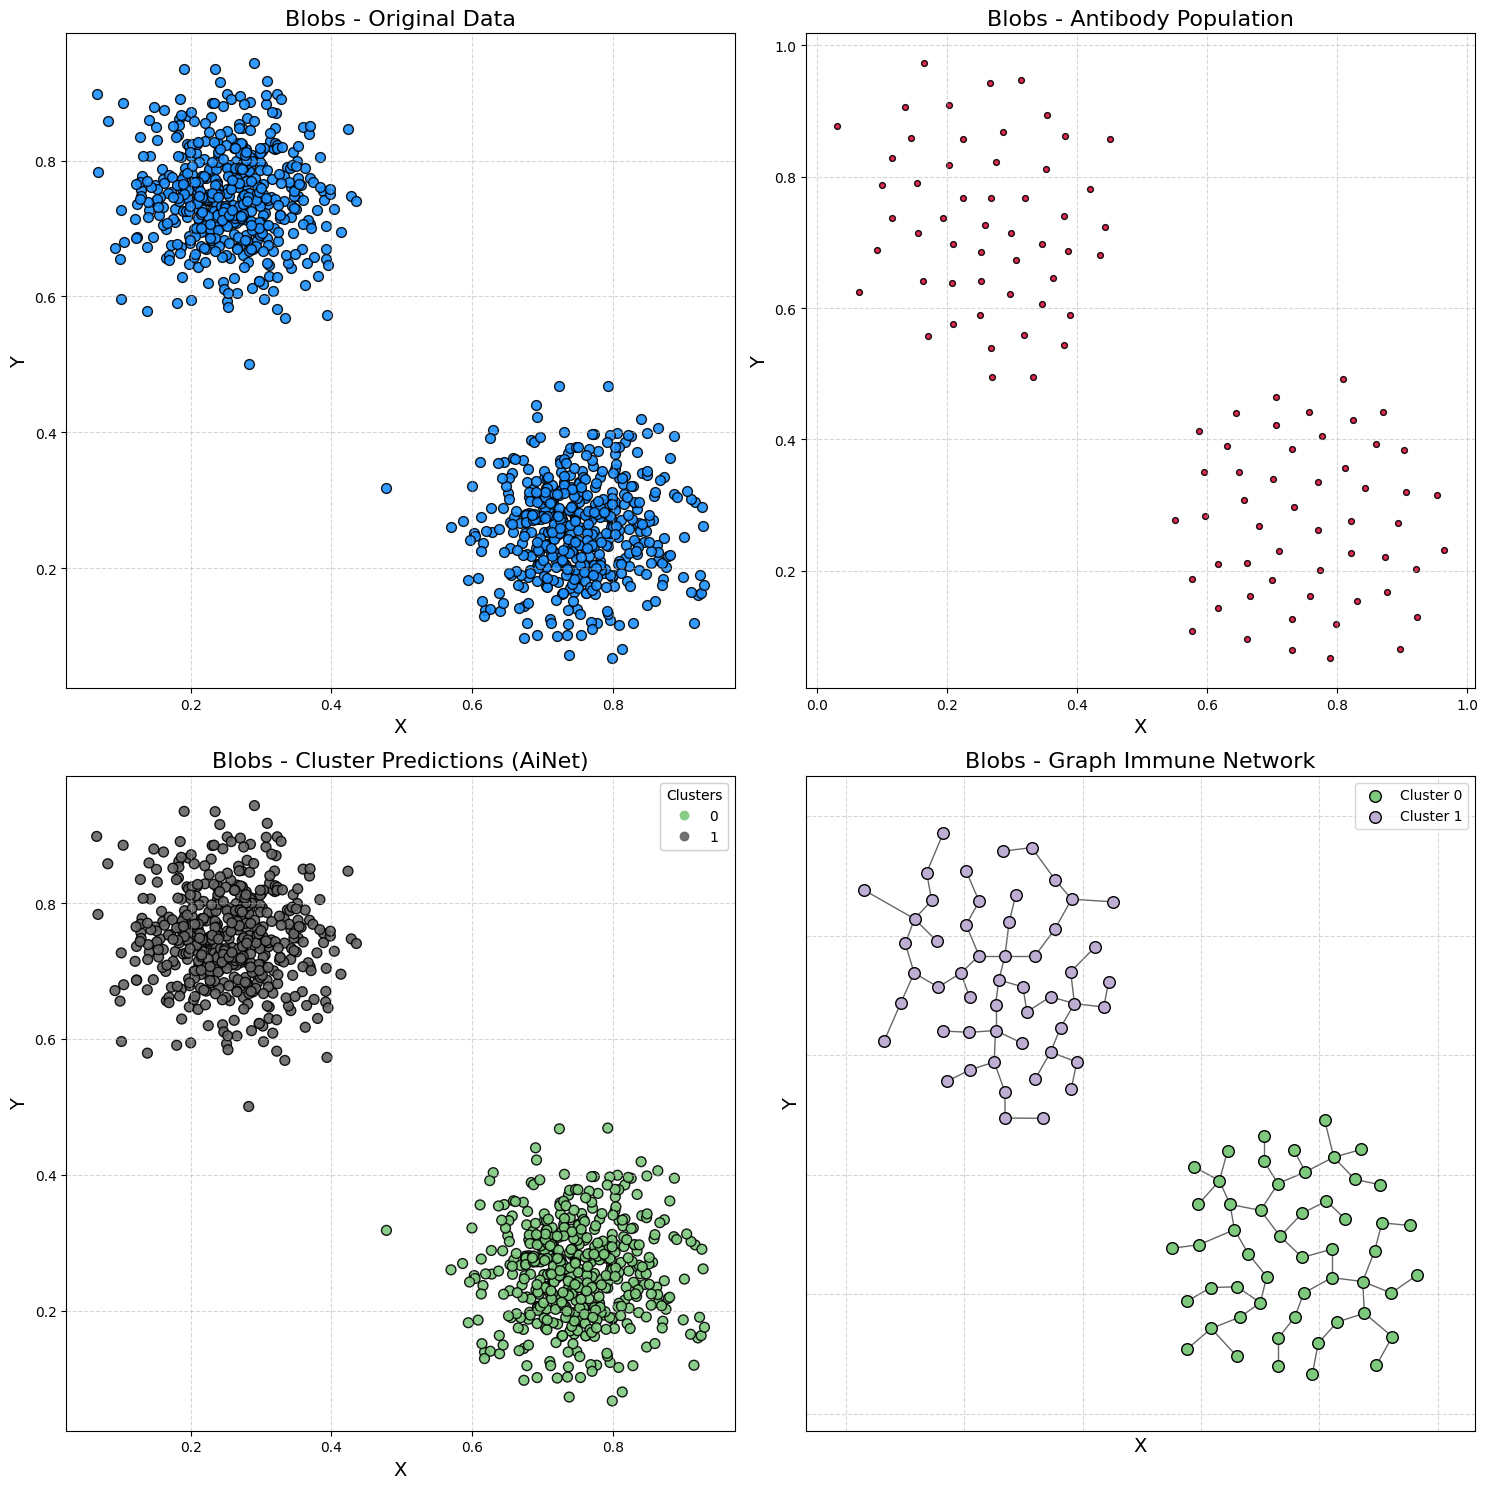
- Blobs: Well-defined spherical clusters.
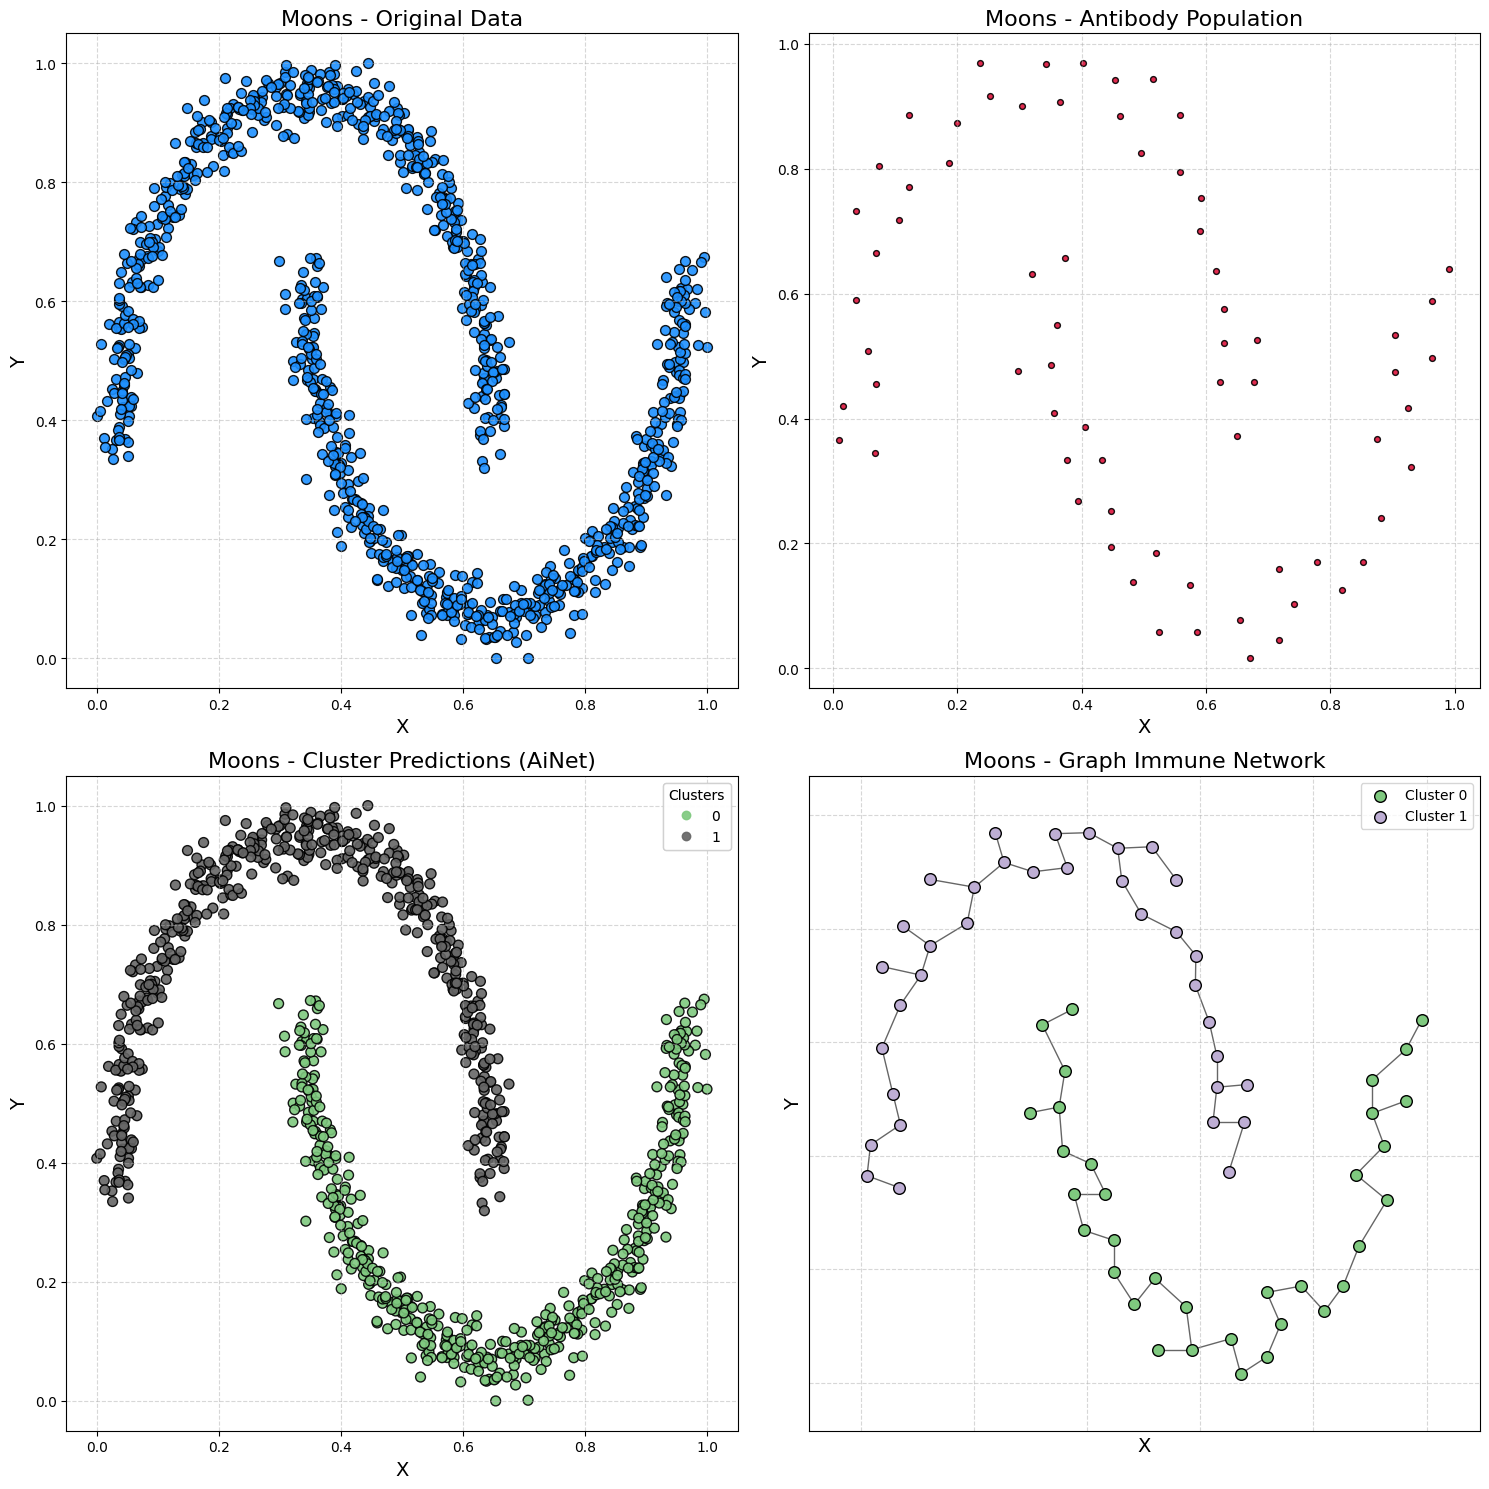
- Moons: Non-linear clusters.
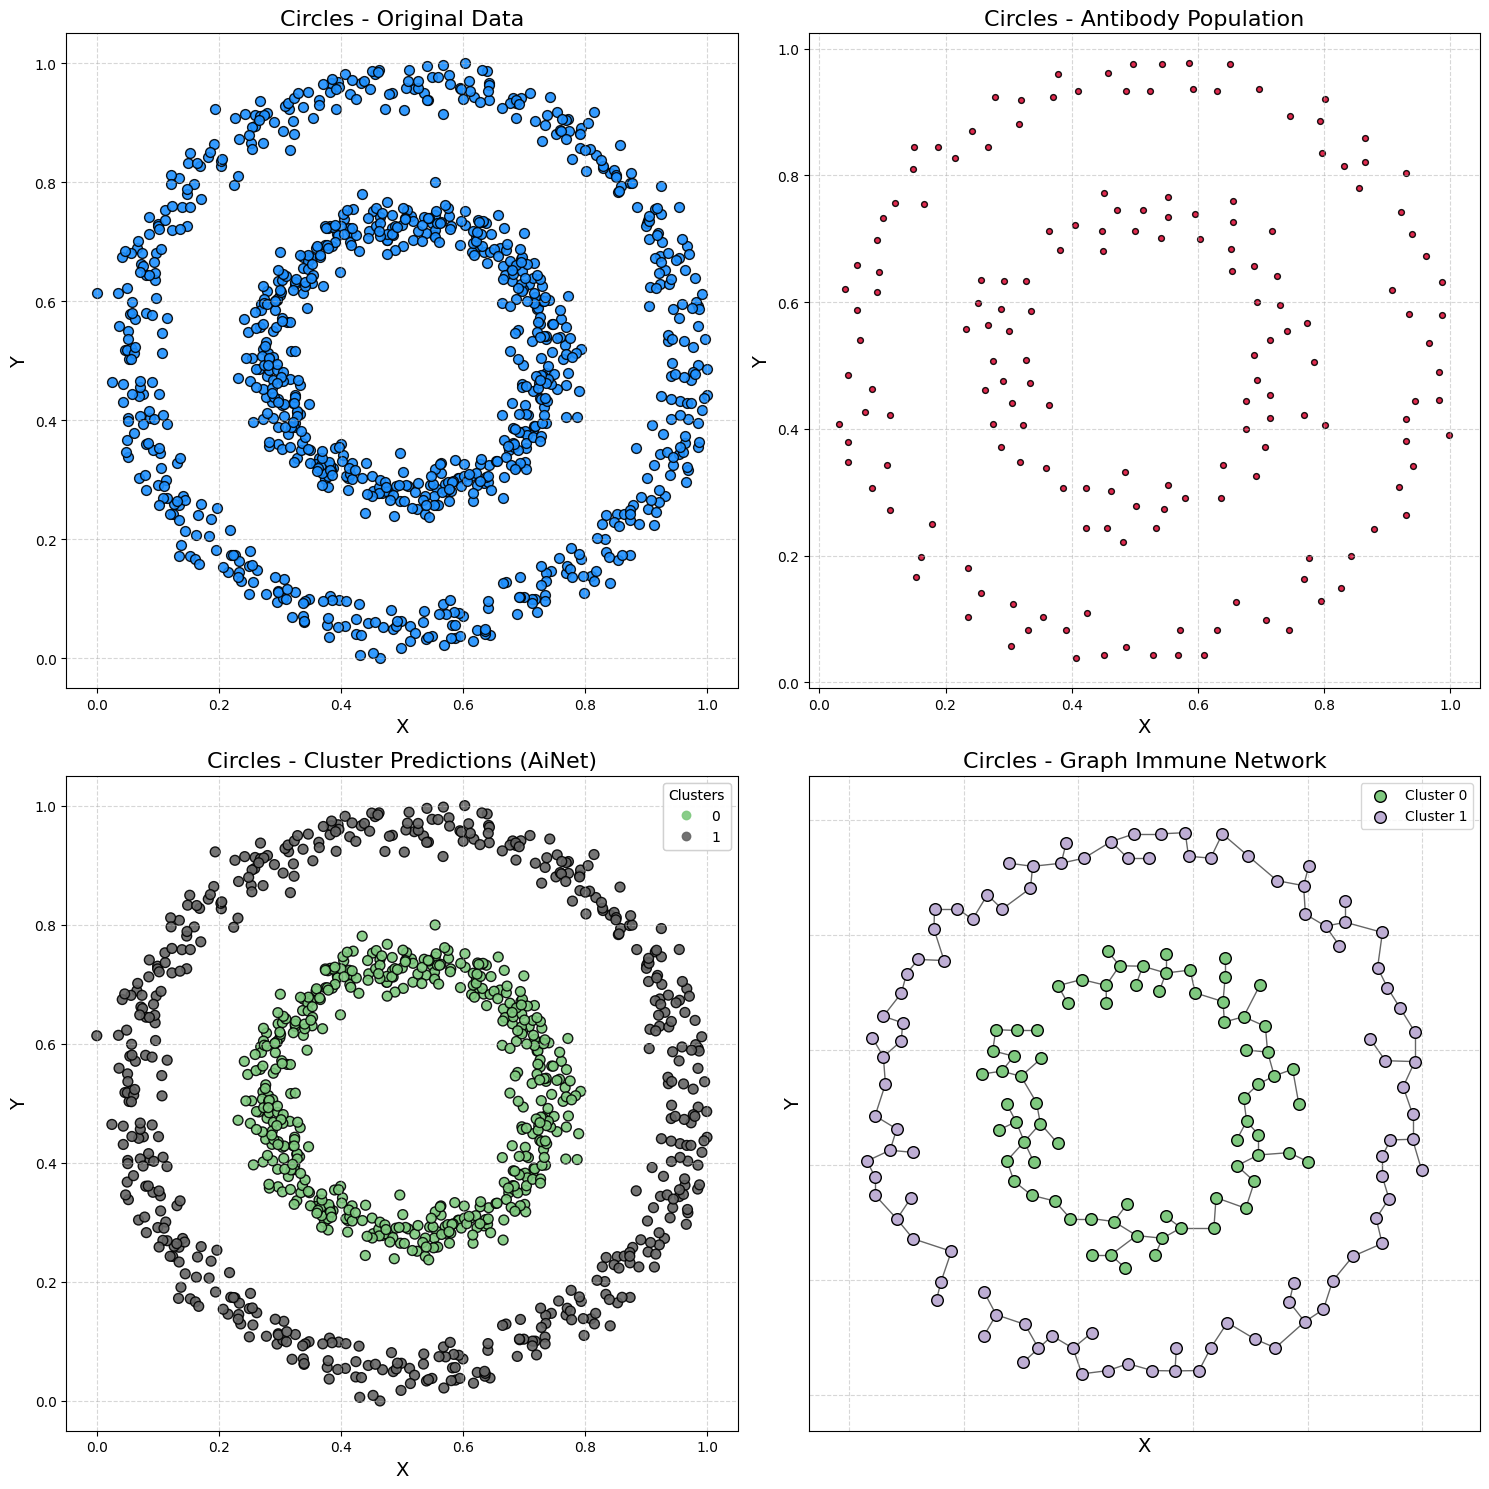
- Circles: Two concentric circles, showing non-linear separation.
Notebook Structure:
- Setup: Install and import libraries.
- Visualization Function: Plot AiNet results.
- Demonstration 1 - Blobs
- Demonstration 2 - Moons
- Demonstration 3 - Circles
Importing the Artificial Immune Network
from aisp.ina import AiNet
Visualization Function
AiNet Visualization Function (plots clusters and immune network)
def plot_immune_network(train_x, predict_y, model, title_prefix=""):
    """
    Plots the clustering results of AiNet.

    Parameters:
        train_x (np.array): Input data.
        predict_y (np.array): Cluster predictions from the model.
        model (AiNet): The trained AiNet model.
        title_prefix (str, optional): A prefix for the plot titles.
    """
    clusters = list(model._memory_network.values())
    network = np.array(model._population_antibodies)

    fig, axs = plt.subplots(2, 2, figsize=(15, 15))
    colors = colormaps.get_cmap('Accent')

    # Original data
    axs[0][0].scatter(train_x[:, 0], train_x[:, 1], color='dodgerblue', alpha=0.9, s=50, marker='o', edgecolors='k')
    axs[0][0].set_title(f'{title_prefix}Original Data', fontsize=16)
    axs[0][0].set_xlabel('X', fontsize=14)
    axs[0][0].set_ylabel('Y', fontsize=14)
    axs[0][0].grid(True, linestyle='--', alpha=0.5)

    # Antibody population
    axs[0][1].scatter(network[:, 0], network[:, 1], color='crimson', alpha=0.9, s=70, marker='.', edgecolors='k')
    axs[0][1].set_title(f'{title_prefix}Antibody Population', fontsize=16)
    axs[0][1].set_xlabel('X', fontsize=14)
    axs[0][1].set_ylabel('Y', fontsize=14)
    axs[0][1].grid(True, linestyle='--', alpha=0.5)

    # Cluster predictions
    scatter = axs[1][0].scatter(train_x[:, 0], train_x[:, 1], c=predict_y, cmap='Accent', s=50, edgecolors='k', alpha=0.9)
    axs[1][0].set_title(f'{title_prefix}Cluster Predictions (AiNet)', fontsize=16)
    axs[1][0].set_xlabel('X', fontsize=14)
    axs[1][0].set_ylabel('Y', fontsize=14)
    axs[1][0].grid(True, linestyle='--', alpha=0.5)
    legend1 = axs[1][0].legend(*scatter.legend_elements(), title="Clusters")
    axs[1][0].add_artist(legend1)

    # Immune Network Graph
    G = nx.Graph()
    positions = {}
    for i, cluster in enumerate(clusters):
        cluster_nodes = [f'{i}_{j}' for j in range(len(cluster))]
        G.add_nodes_from(cluster_nodes)
        for node, point in zip(cluster_nodes, cluster):
            positions[node] = tuple(point)
        dist_matrix = squareform(pdist(cluster))
        mst_local = minimum_spanning_tree(dist_matrix).toarray()
        for row_idx, row in enumerate(mst_local):
            for col_idx, weight in enumerate(row):
                if weight > 0:
                    G.add_edge(cluster_nodes[row_idx], cluster_nodes[col_idx], weight=weight)
    for i, cluster in enumerate(clusters):
        cluster_nodes = [f'{i}_{j}' for j in range(len(cluster))]
        nx.draw_networkx_nodes(G, positions, nodelist=cluster_nodes, ax=axs[1][1],
                               node_color=[colors(i)], node_size=70, edgecolors='k', label=f'Cluster {i}')
    nx.draw_networkx_edges(G, positions, ax=axs[1][1], alpha=0.6)
    axs[1][1].set_title(f'{title_prefix}Graph Immune Network', fontsize=16)
    axs[1][1].set_xlabel('X', fontsize=14)
    axs[1][1].set_ylabel('Y', fontsize=14)
    axs[1][1].grid(True, linestyle='--', alpha=0.5)
    axs[1][1].legend()
    plt.tight_layout()
    plt.show()
Demonstration 1 - Blobs Dataset
Generating data
samples, output = make_blobs(
    n_samples=1000,
    cluster_std=0.07,
    center_box=(0.0, 1.0),
    centers=[[0.25, 0.75], [0.75, 0.25]],
    random_state=1234,
)
Training AiNet
model = AiNet(suppression_threshold=0.96, affinity_threshold=0.95, mst_inconsistency_factor=3, seed=123)
predict_y = model.fit_predict(samples)
Output:
✔ Set of memory antibodies for classes (0, 1) successfully generated | Clusters: 2 | Population of antibodies size: 104: ┇██████████┇ 10/10 total training interactions
Silhouette score
silhouette = silhouette_score(samples, predict_y)
print(f"Silhouette Coefficient: {silhouette:.3f}")
Output:
Silhouette Coefficient: 0.826
Visualization
plot_immune_network(samples, predict_y, model, title_prefix="Blobs - ")
Demonstration 2 - Moons Dataset
Generating data
samples, output = make_moons(n_samples=1000, noise=0.05, random_state=42)
samples = MinMaxScaler().fit_transform(samples)
Training AiNet
model = AiNet(suppression_threshold=0.95, affinity_threshold=0.97, mst_inconsistency_factor=2.5, seed=123)
predict_y = model.fit_predict(samples)
Output:
✔ Set of memory antibodies for classes (0, 1) successfully generated | Clusters: 2 | Population of antibodies size: 69: ┇██████████┇ 10/10 total training interactions
Silhouette score
silhouette = silhouette_score(samples, predict_y)
print(f"Silhouette Coefficient: {silhouette:.3f}")
Output:
Silhouette Coefficient: 0.398
Visualization
plot_immune_network(samples, predict_y, model, title_prefix="Moons - ")
Demonstration 3 - Circles Dataset
Generating data
samples, output = make_circles(n_samples=1000, noise=0.05, factor=0.5, random_state=42)
samples = MinMaxScaler().fit_transform(samples)
Training AiNet
model = AiNet(suppression_threshold=0.97, affinity_threshold=0.98, mst_inconsistency_factor=3.8, seed=123)
predict_y = model.fit_predict(samples)
Output:
✔ Set of memory antibodies for classes (0, 1) successfully generated | Clusters: 2 | Population of antibodies size: 169: ┇██████████┇ 10/10 total training interactions
Silhouette score
silhouette = silhouette_score(samples, predict_y)
print(f"Silhouette Coefficient: {silhouette:.3f}")
Output:
Silhouette Coefficient: 0.112
Visualization
plot_immune_network(samples, predict_y, model, title_prefix="Circles - ")